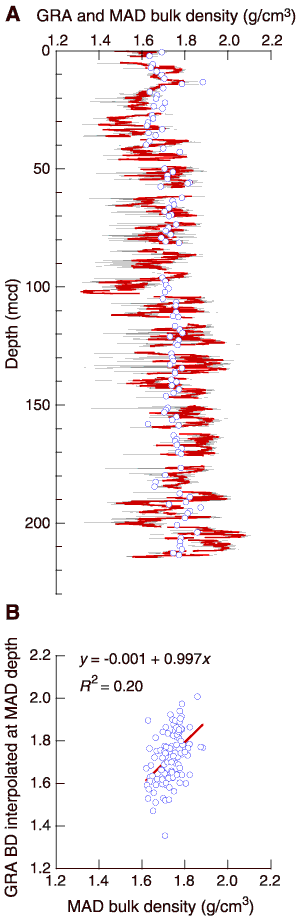
Figure F15. A. Moisture and density (MAD) (circles) and gamma ray attenuation (GRA) (gray line) bulk densities. The thick line represents the smoothed GRA bulk density. B. Linear regression between the MAD and GRA bulk density (BD) at MAD measurement locations.