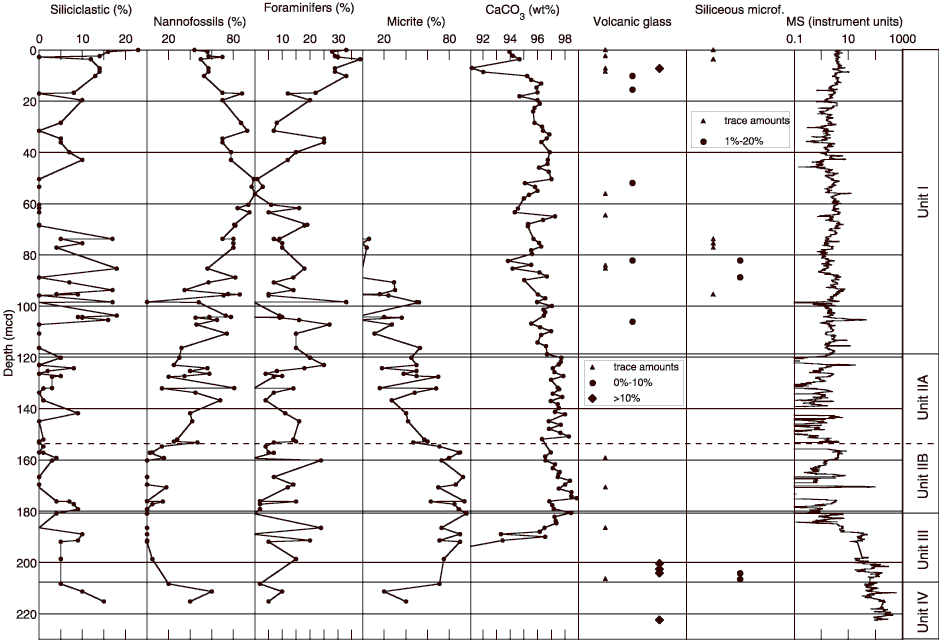
Figure F13. Major components observed in smear slides (dominant lithologies only) compared to carbonate concentration and the magnetic susceptibility (MS) record. Note that 1.5 instrument units have been added to the 5-point average of the original data set (see Fig. F11) in order to exclude negative values for logarithmic scaling. microf. = microfossil.


![]()