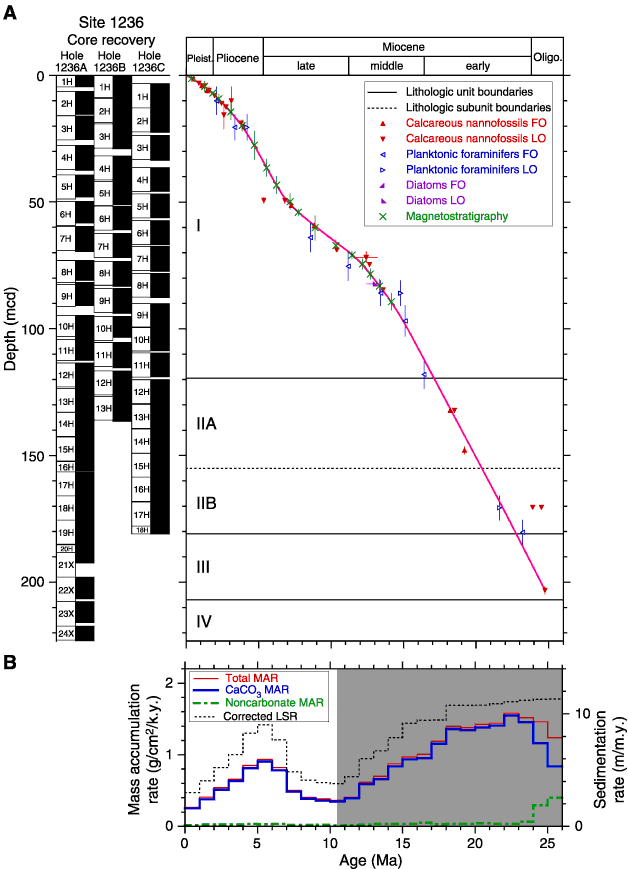
Figure F29. A. Shipboard biostratigraphic and magnetostratigraphic datums and age-depth model. B. Corrected linear sedimentation rates (LSRs), total mass accumulation rates (MARs), and carbonate MARs are calculated from the smooth age model, average dry density, and calcium carbonate concentrations at 1-m.y. intervals. Shaded areas represent time period influenced by downslope. FO = first occurrence, LO = last occurrence.