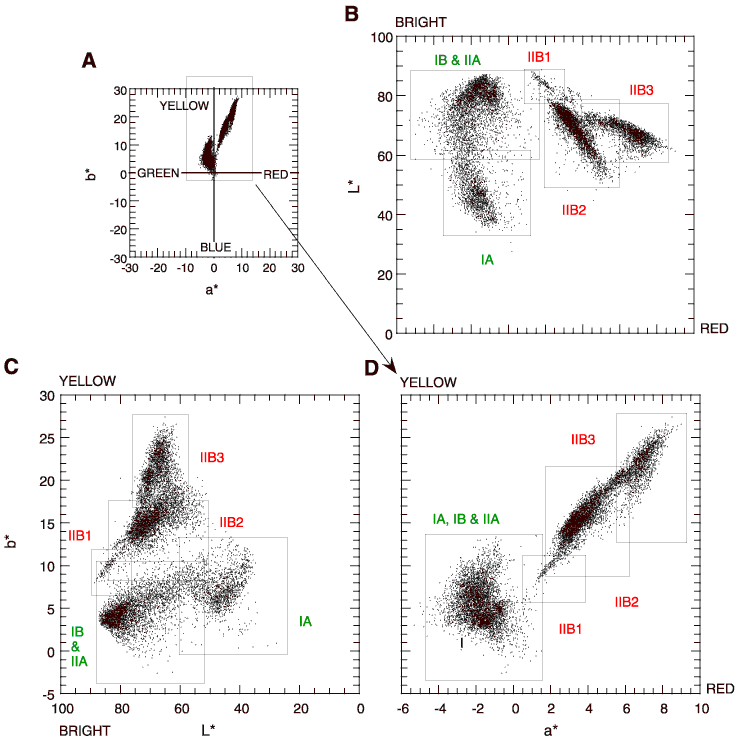
Figure F13. Site 1237 color measurements (spliced record). A. Color measurements plotted in the a*-b* plane. B. Close up of the L*-a* plane. C. Close-up of the L*-b* plane. D. Close-up of the a*-b* plane. Measurements plot in two main regions in the a*-b* color plane: the generally greenish sediments of Unit I and Subunit IIA group in the first quadrant, whereas the reddish sediments of the Subunit IIB cluster more tightly in the second quadrant. Three populations (IIB1, IIB2, and IIB3) can be distinguished within the red part of the color space.


![]()