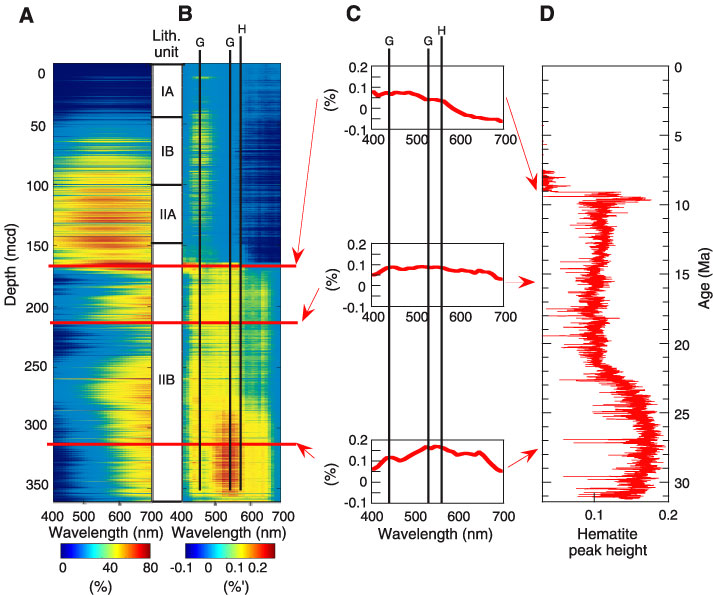
Figure F25. Sequential depth plots of (A) raw reflectance data, (B) their first derivatives, (C) typical first derivatives at various levels within sediments, and (D) a preliminary uncalibrated hematite record (i.e., hematite peak height) vs. age for the spliced record at Site 1237. Characteristic peaks for goethite (G) and hematite (H) are indicated. %´ = the first derivative of % with respect to wavelength.