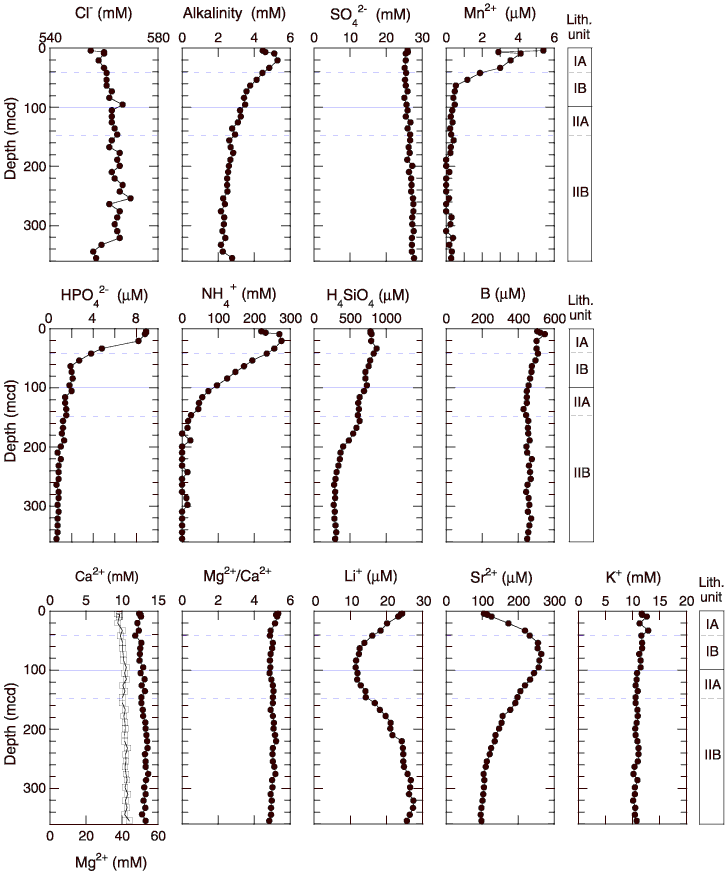
Figure F34. Interstitial water geochemical data for Site 1237. Open squares = calcium concentrations. Solid horizontal lines = lithologic unit boundaries, dashed lines = subunit boundaries (see
"Description of Lithologic Units" in "Lithostratigraphy"). Values below the detection limit (0.1 µM for manganese and 11 µM for ammonium) are plotted at zero. Iron and barium concentrations (not plotted) are in almost all samples below their respective detection limits (iron = 1.1 µM; barium = 0.03 µM).