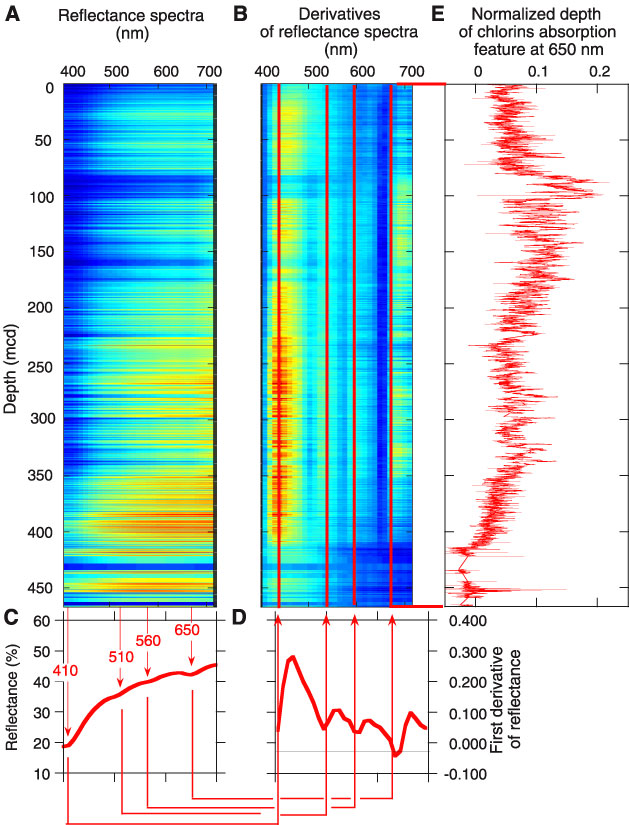
Figure F21. A. Sequential depth plot of raw reflectance spectra for Site 1238. Cool colors (blue) indicate low values, and warm colors (red) indicate high values. B. First derivatives of raw reflectance data with respect to wavelength. C. A representative reflectance spectrum exhibits absorption features typical of organic pigments at 410, 510, 560, and 650 nm. D. Inflection points of the first derivative of the reflectance spectrum indicate the location of the same absorption features and are easily distinguishable on the sequential plot of the first derivatives. E. The normalized absorption feature at 650 nm, relative to reflectances at 630 and 700 nm and normalized to a measure of the general slope of the spectrum (i.e., Depth650 = {R630 + [3/7 x (R700 - R630) -R650]}/[R700 - R400]), is plotted with depth as a proxy for abundance of
chlorins.