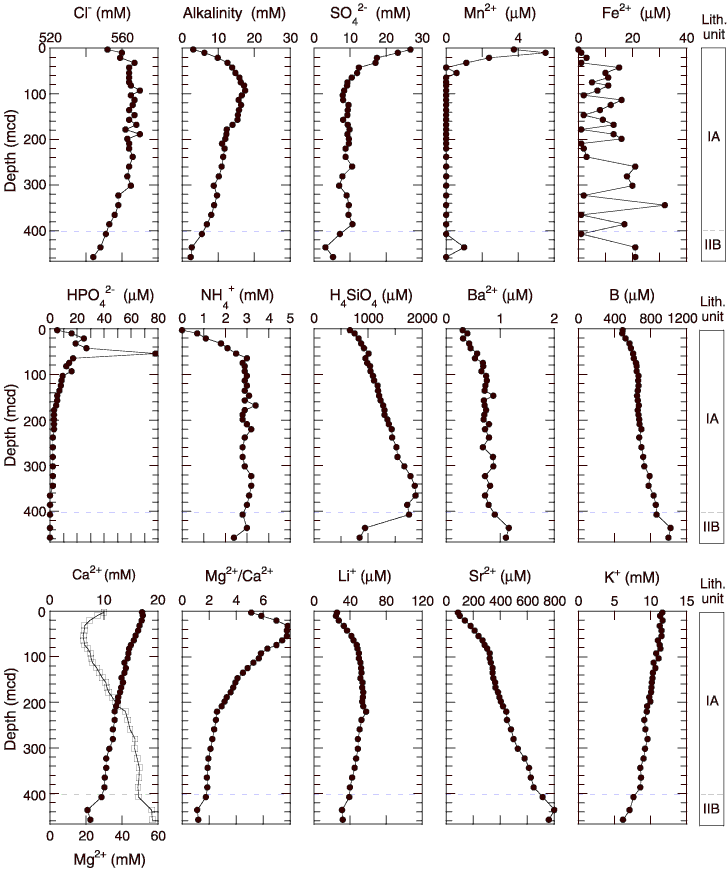
Figure F31. Interstitial water geochemical data for Site 1238. Open squares = calcium concentrations. The horizontal line indicates the lithologic subunit boundary (see "Lithostratigraphy"). Values below the detection limit (0.01 µM for manganese, 0.2 µM for iron, 1 µM for phosphate, and 0.4 mM for ammonium) are plotted at zero. Note that the blank correction for barium (0.9 µM) was significant compared to total measured concentrations, so this profile should be interpreted with caution.