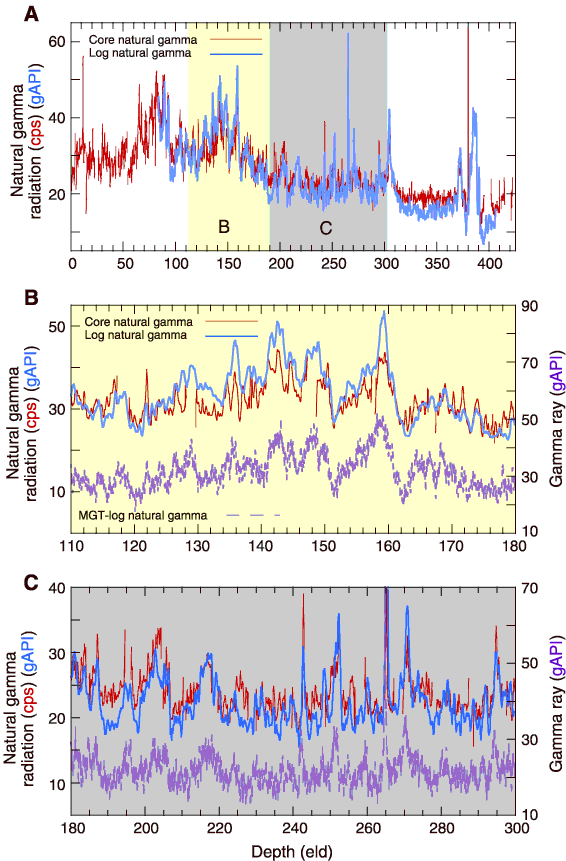
Figure F38. Downhole natural gamma ray activity and core natural gamma ray activity plotted against the Sagan-derived equivalent log depth (eld) for Hole 1238A. A. Total interval cored and logged. B. Interval 110-180 m (eld) C. Interval 180-300 mbsf. Core logging data are in counts per second (cps); downhole logging data are in American Petroleum Institute (gAPI) units. MGT = Multi-Sensor Spectral Gamma Ray Tool.