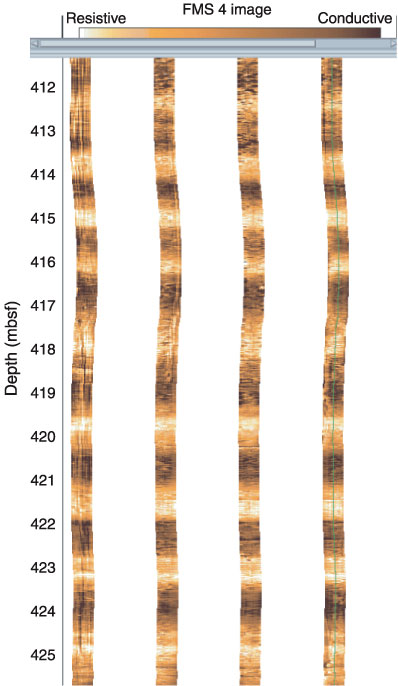
Figure F35.
Dynamically normalized Formation MicroScanner (FMS) image of the borehole illustrating the meter-scale banding related to opal to carbonate oscillations.