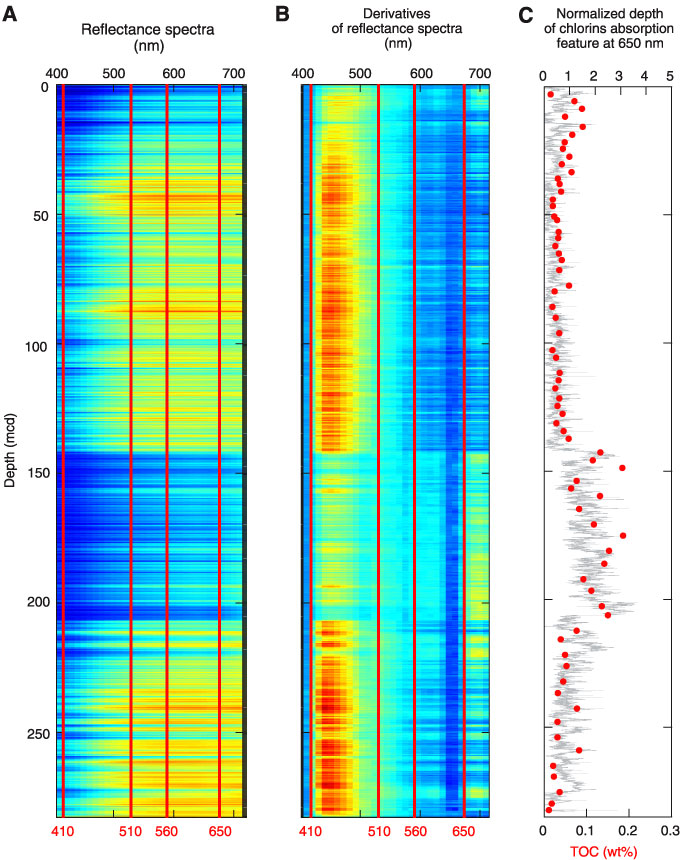
Figure F15. A. Sequential depth plots of raw reflectance data for Site 1240. B. First derivatives of raw reflectance data. Red lines = absorption features typical of organic pigments (i.e., at 410, 510, 560, and 650 nm). C. The depth of the absorption feature at 650 nm, estimated relative to 630 and 700 nm and normalized to a measure of the general slope of the spectrum, is plotted with depth as a proxy for the abundance of chlorins. Total organic carbon (TOC) measurements are also plotted for comparison.