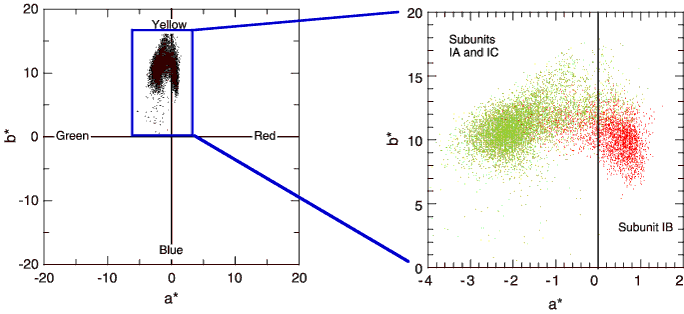
Figure F19. Color measurements for Site 1240 (spliced record) plotted in the a*-b* color plane (left). A close up of the measurement field (right) shows that color values in Subunit IB are a distinct population characterized by a red hue (i.e., a* > 0).


![]()