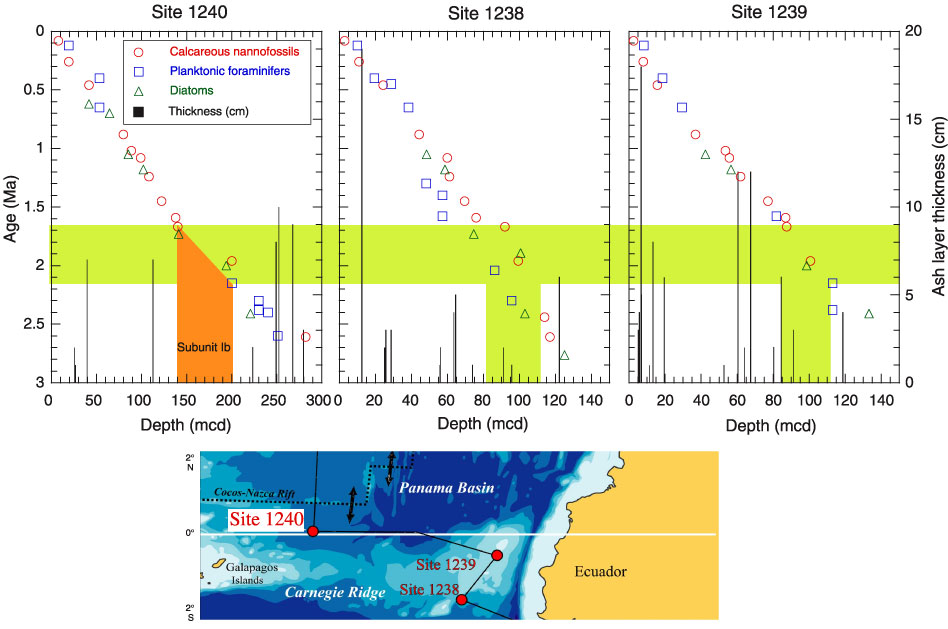
Figure F21. Downhole distribution of ash layers for Sites 1240, 1239, and 1238, plotted on an age vs. depth profile based on biostratigraphic datums. Length of bars = ash layer thickness. Color shade = time interval of Subunit IB at Site 1240. The map at the bottom indicates the geographical position of the sites.