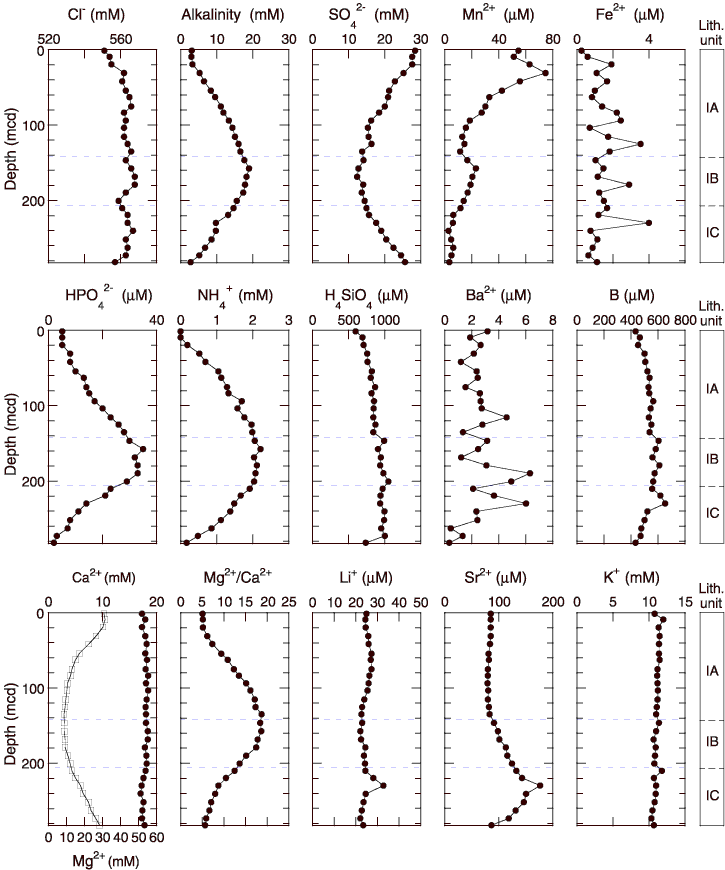
Figure F28. Interstitial water geochemical data for Site 1240. Open squares = calcium concentrations. Horizontal dashed lines indicate lithologic subunit boundaries (see
"Description of Lithologic Unit" in "Lithostratigraphy"). Values below the detection limit (0.15 mM for ammonium) are plotted at zero. Note that the blank correction for iron (0.8 µM) was significant compared to many of the measured concentrations, so this profile should be interpreted with caution.