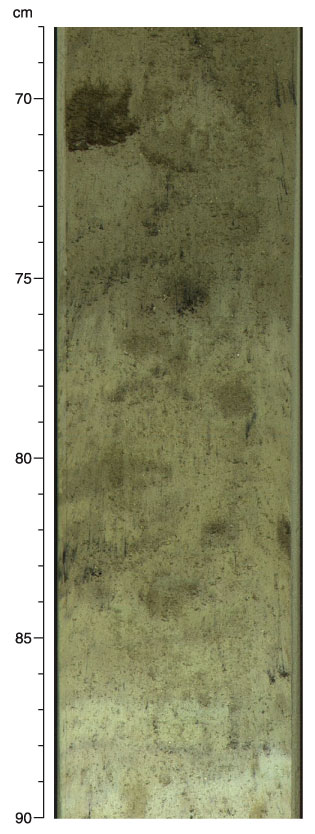
Figure F19.
Close-up photograph of dark and light color variability in Subunit IA (interval 202-1241A-4H-6, 68-90 cm).