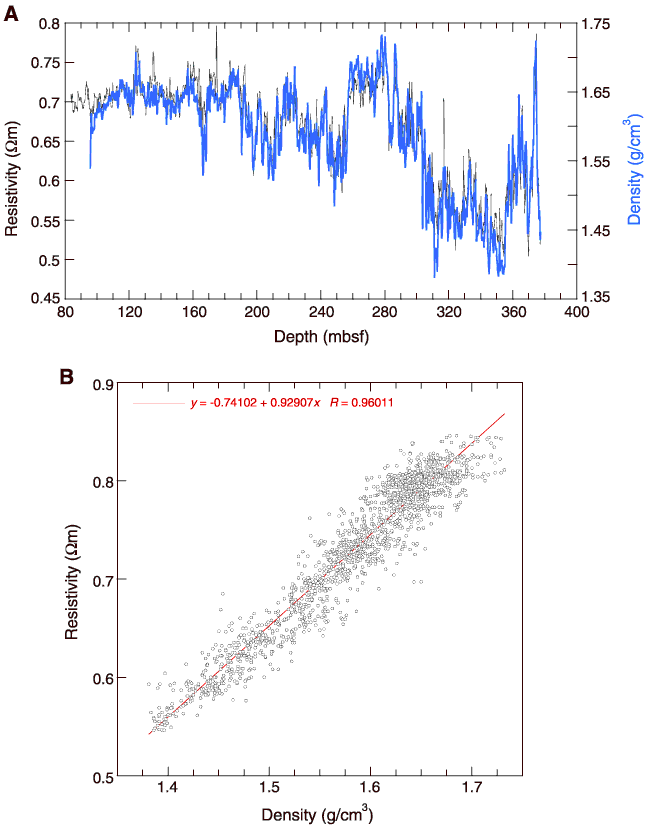
Figure F37. A. Downhole density (blue) and resistivity (black) logs vs. depth over the length of the sequence logged with both tools in Hole 1241B. B. Scatterplot of density vs. resistivity over the sequence represented in A, showing the strongly linear relationship between the two logs.


![]()