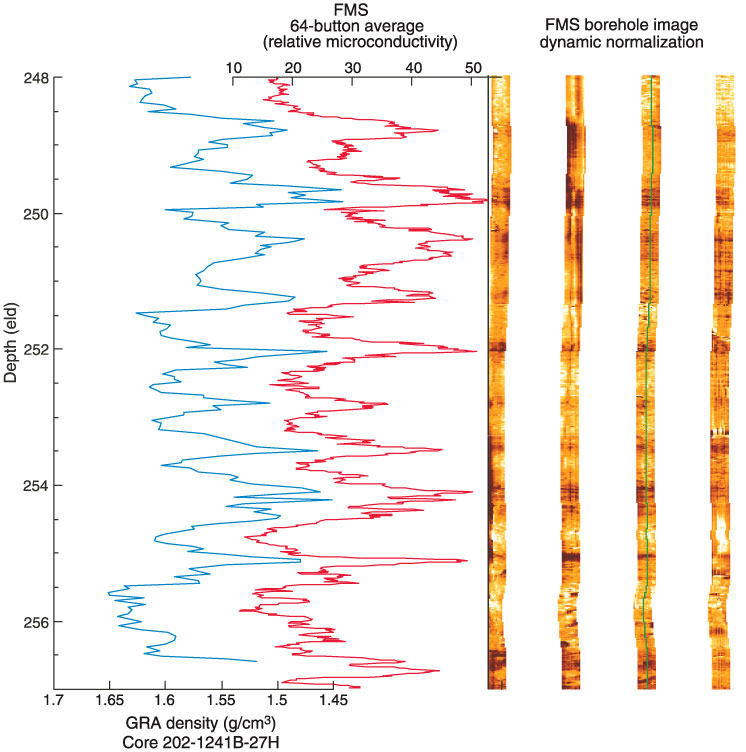
Figure F38. Dynamically normalized Formation MicroScanner (FMS) image of the borehole illustrating the meter-scale banding related to opal to carbonate oscillations. Shown to the left is the average of the 64 microconductivity sensors used to generate the image (red line) and the core gamma ray attenuation (GRA) density record (blue line).