
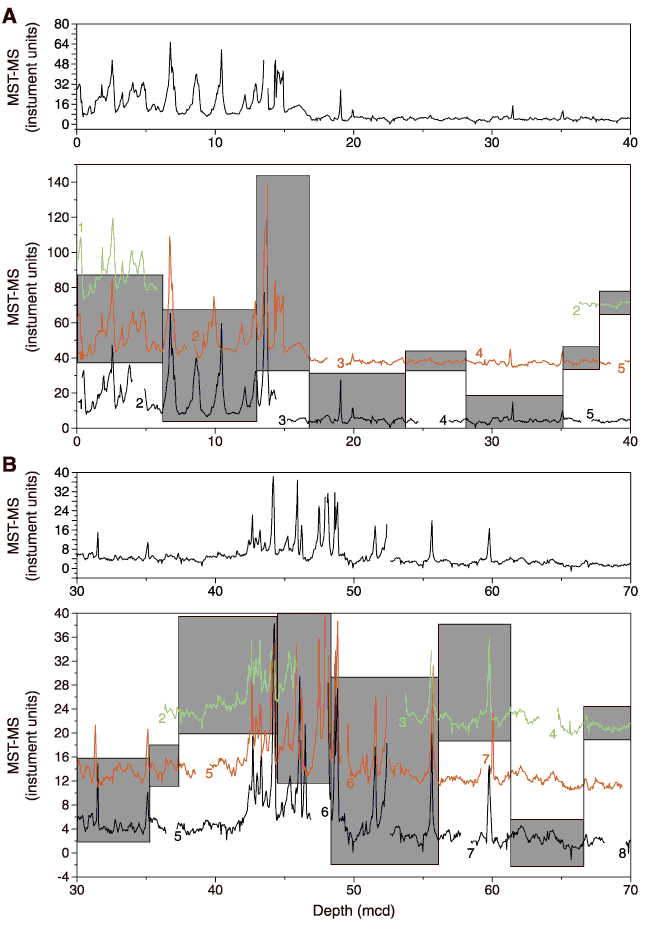
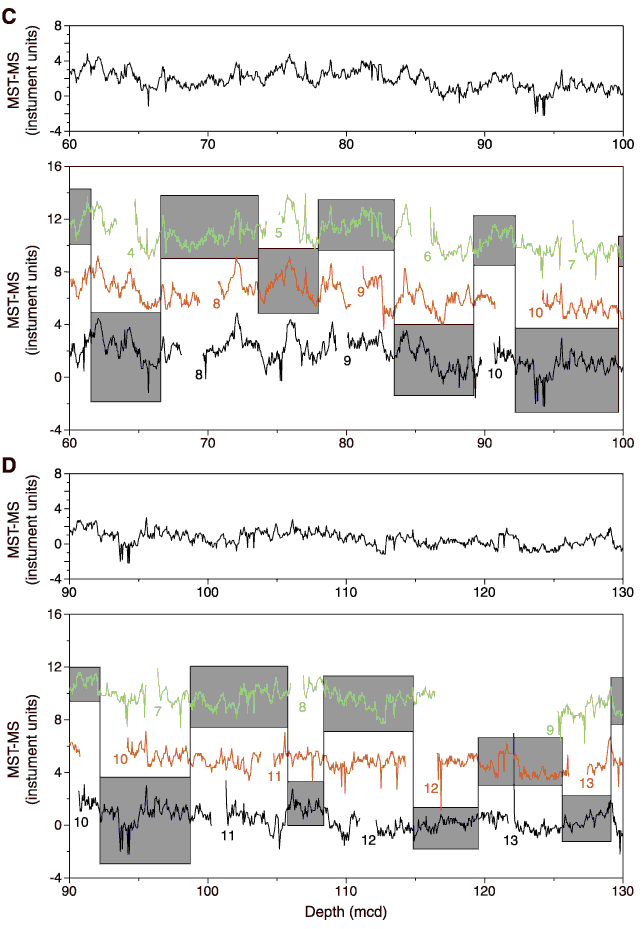
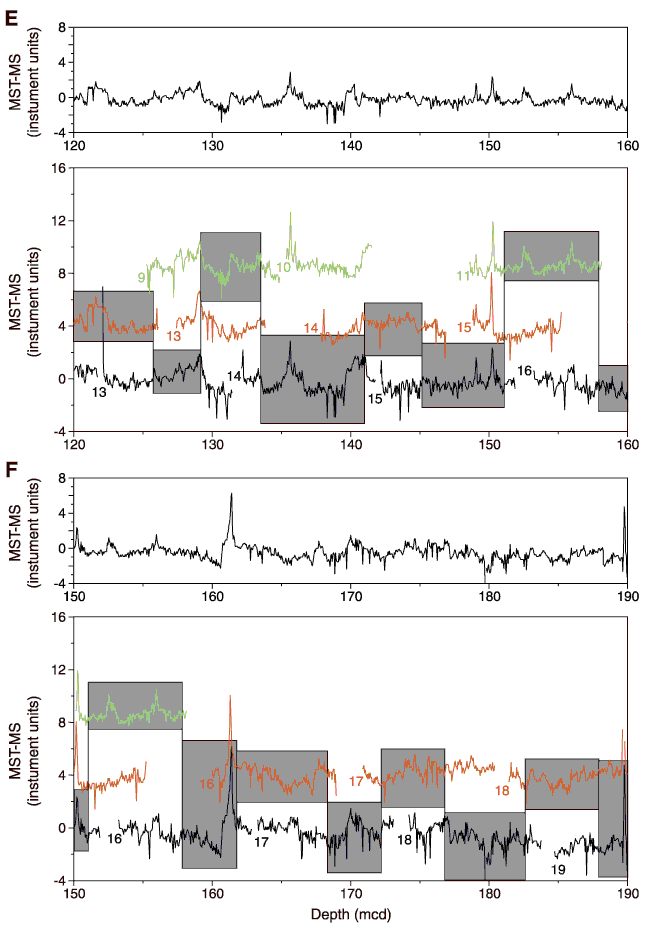
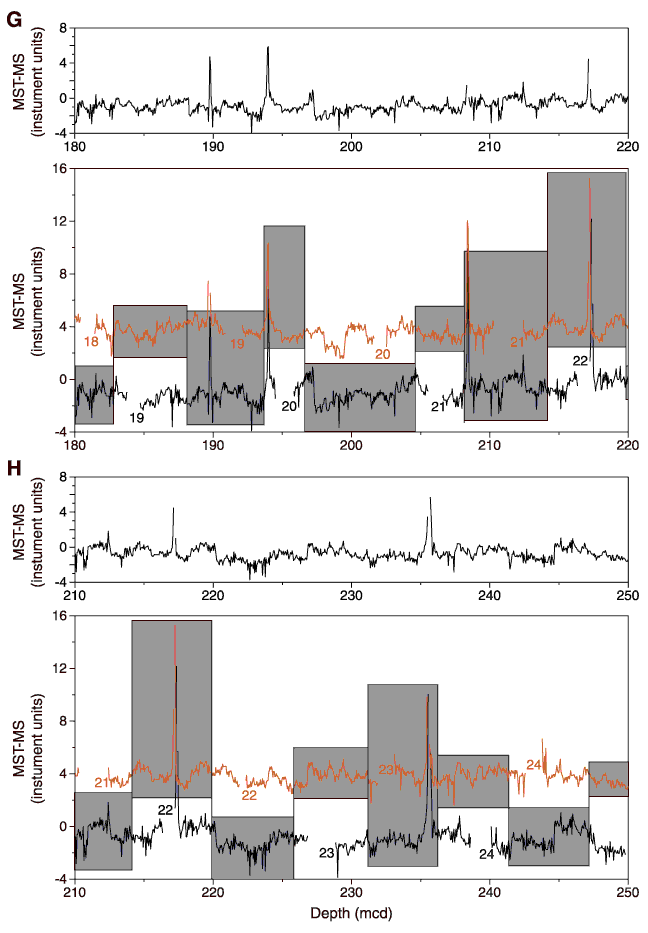
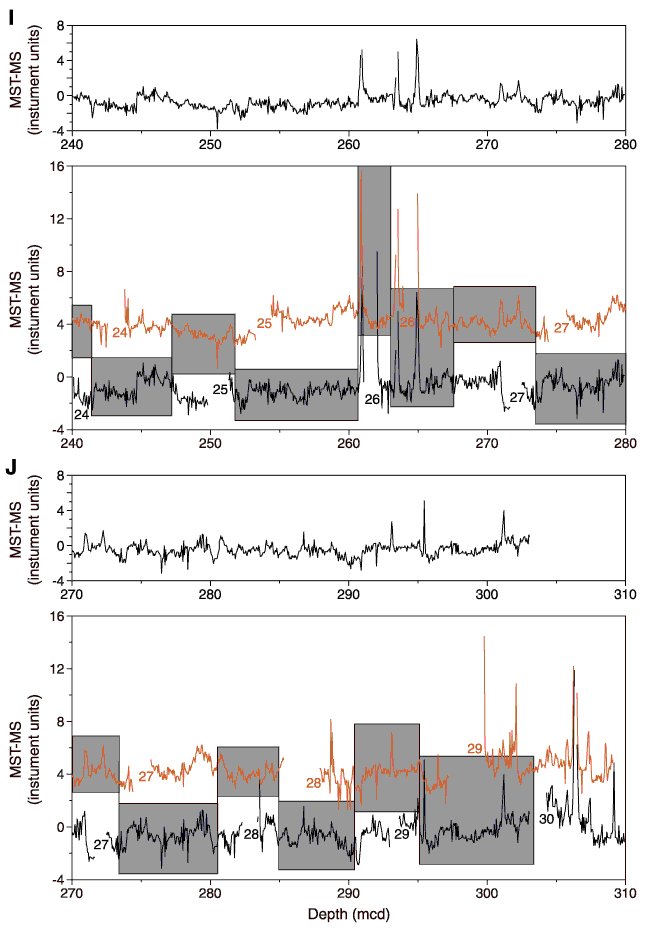
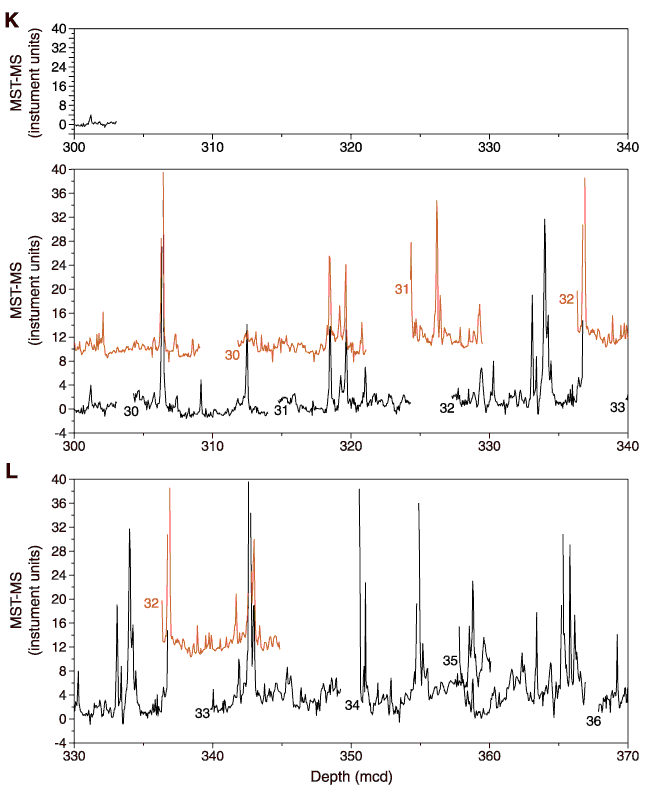
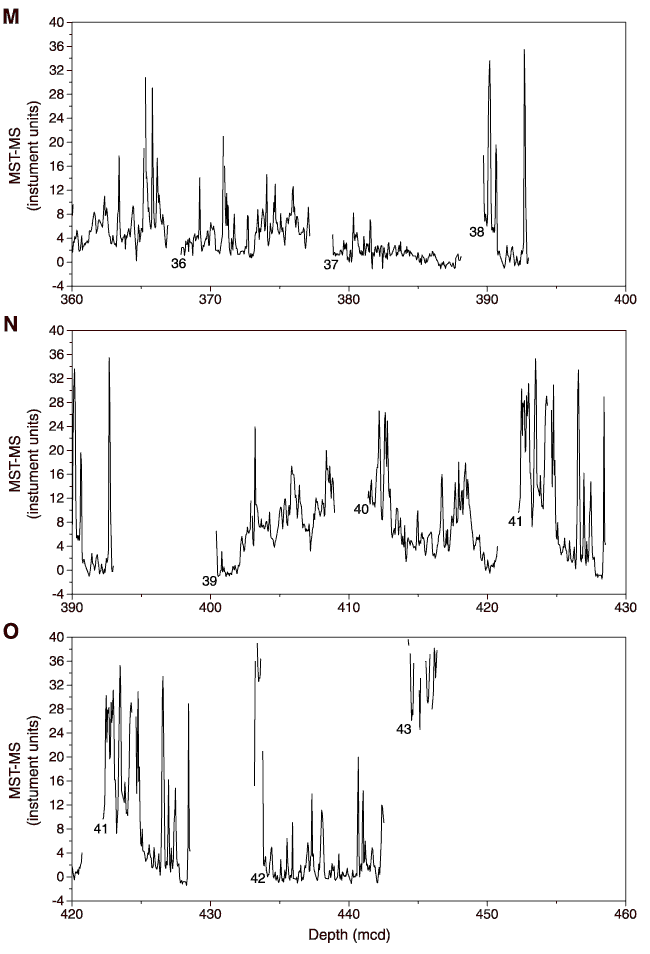
Figure F9. Magnetic susceptibility data (MST-MS) vs. mcd for the spliced record and Holes 1241A (black), 1241B (red), and 1241C (green). Gray boxes indicate the portions of cores that are in the splice. A. 0-40 mcd. B. 30-70 mcd. C. 60-100 mcd. D. 90-130 mcd. E. 120-160 mcd. F. 150-190 mcd. G. 180-220 mcd. H. 210-250 mcd. I. 240-280 mcd. J. 270-310 mcd. K. 300-340 mcd. L. 330-370 mcd. M. 360-400 mcd. N. 390-430 mcd. O. 420-460
mcd.


![]()