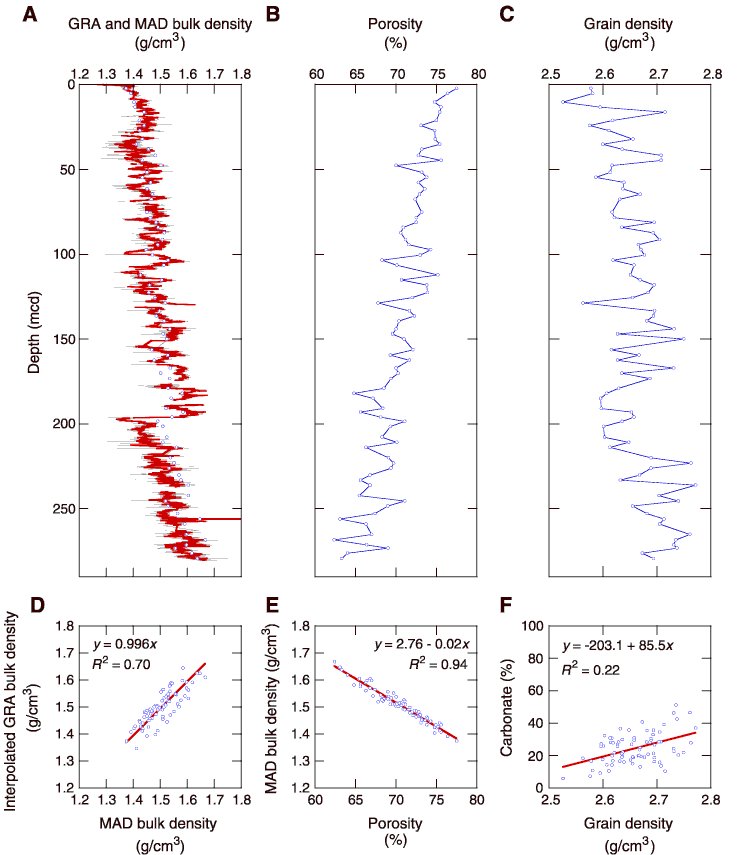
Figure F20. Physical properties measurements for Site 1242. A. Gamma ray attenuation (GRA) bulk density (line) and moisture and density (MAD) bulk density (symbols). Thin line = raw data, red line = smoothed record. B. Porosity. C. Grain density. D. Correlation between interpolated GRA and discrete MAD bulk density measurements. E. Correlation between MAD bulk density and porosity. F. Correlation between CaCO3 and grain density.


![]()