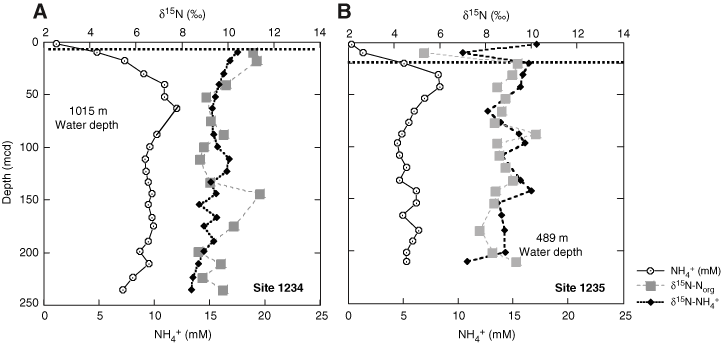
Figure F3. (A) Site 1234 and (B) Site 1235 pore water ammonium concentrations profile (USC measurements are plotted) and isotopic composition of pore water ammonium and Norg. Dotted lines indicate depths where sulfate is depleted below detection limit.


![]()