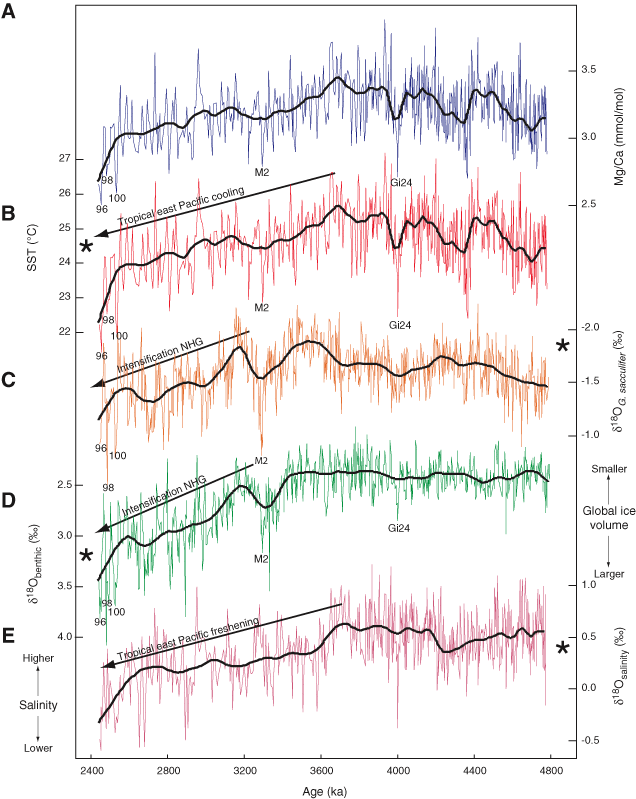
Figure F2. Results for Site 1241 for the time interval 4.8–2.4 Ma. A. Mg/Ca ratios, measured in foraminiferal tests of the planktonic foraminifer Globigerinoides sacculifer. B. Sea-surface temperatures (SSTs), calculated from the Mg/CaG.sacculifer ratios using the equation of Nürnberg et al. (2000). C.  18O, measured in foraminiferal tests of the planktonic foraminifer G. sacculifer. D.
  18O, measured on benthic foraminifers (Tiedemann et al., this volume). E.
  18Osalinity, calculated by subtracting the normalized
  18Obenthic record from the
  18Owater record. Arrows indicate trends associated with intensification of Northern Hemisphere glaciation (NHG) and the tropical cooling and freshening in the east Pacific. Thick curved lines represent best fits on the data, showing variations on timescales >185 k.y. Numbers 96, 98, 100, M2, and Gi24 indicate marine isotope stages, according to the isotope nomenclature of Shackleton et al. (1995). * = modern property values at the paleolocation of Site 1241 (Levitus and Boyer, 1994).


 18O, measured in foraminiferal tests of the planktonic foraminifer G. sacculifer. D.
  18O, measured on benthic foraminifers (Tiedemann et al., this volume). E.
  18Osalinity, calculated by subtracting the normalized
  18Obenthic record from the
  18Owater record. Arrows indicate trends associated with intensification of Northern Hemisphere glaciation (NHG) and the tropical cooling and freshening in the east Pacific. Thick curved lines represent best fits on the data, showing variations on timescales >185 k.y. Numbers 96, 98, 100, M2, and Gi24 indicate marine isotope stages, according to the isotope nomenclature of Shackleton et al. (1995). * = modern property values at the paleolocation of Site 1241 (Levitus and Boyer, 1994).
![]()