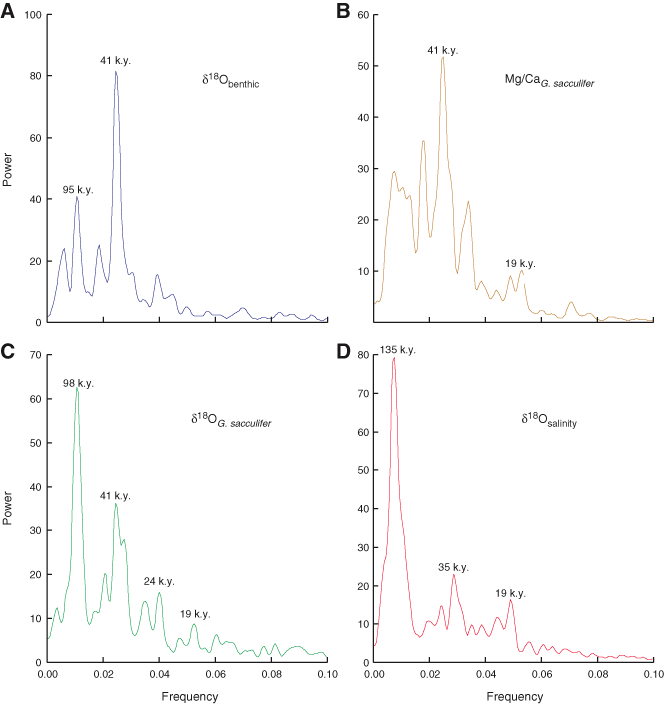
Figure F4. Spectral analysis for the time interval 3.7–2.4 Ma. Time series analyses were performed with AnalySeries 1.2 (Paillard et al., 1996). A.  18O, measured on benthic foraminifers (Tiedemann et al., this volume). B. Mg/Ca ratios, measured in foraminiferal tests of the planktonic foraminifer Globigerinoides sacculifer. C.
  18O, measured in foraminiferal tests of the planktonic foraminifer G. sacculifer. D.
  18Osalinity, calculated by subtracting the normalized
  18Obenthic record from the
  18Owater record.


 18O, measured on benthic foraminifers (Tiedemann et al., this volume). B. Mg/Ca ratios, measured in foraminiferal tests of the planktonic foraminifer Globigerinoides sacculifer. C.
  18O, measured in foraminiferal tests of the planktonic foraminifer G. sacculifer. D.
  18Osalinity, calculated by subtracting the normalized
  18Obenthic record from the
  18Owater record.
![]()