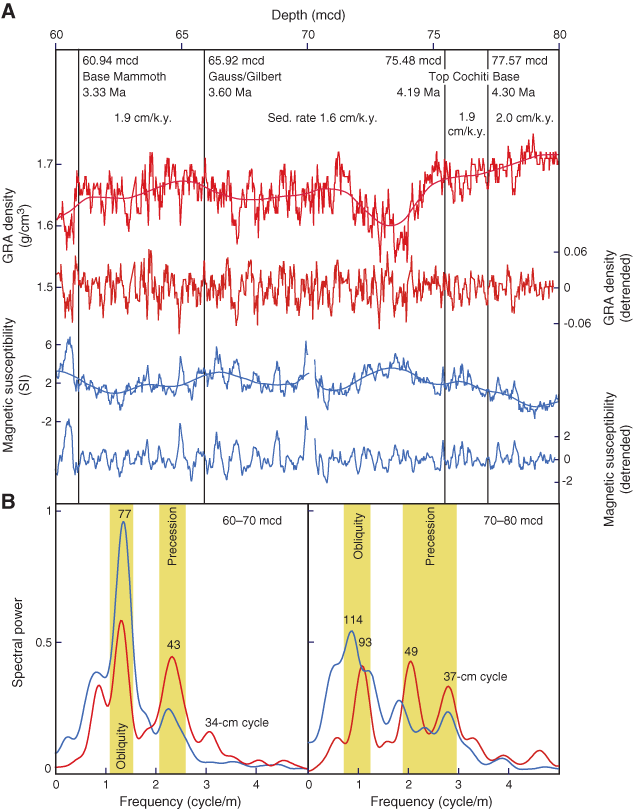
Figure F2. Cyclic variation in gamma ray attenuation (GRA) density and magnetic susceptibility at Site 1237. A. Fluctuations in GRA density (red curve) and magnetic susceptibility (blue curve) between 60 and 80 mcd. Each record was detrended by subtraction of the Gaussian weighted smooth (thick lines). The detrended records were subjected to spectral analyses. Ages and depths of magnetic reversal boundaries are indicated. Sedimentation rates were estimated from magnetostratigraphy. B. Results from spectral analyses for the intervals from 60–70 mcd and 70–80 mcd. Cycle lengths are given in cm. Considering the sedimentation rates shown in A, cycles of 37–43 cm reflect precession cycles (23 k.y. and 19 k.y.) and cycles of 77–114 cm are related to obliquity cycles (41 k.y.).


![]()