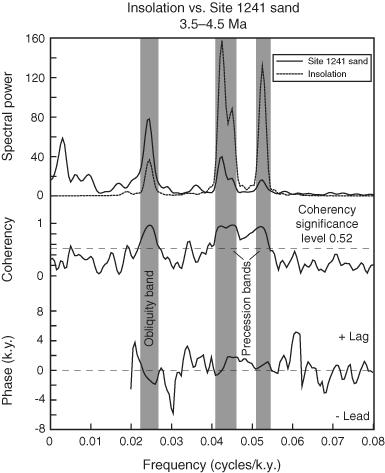
Figure F7. Example of cross-spectral analyses between Northern Hemisphere summer insolation (65°N) and the percent sand record from Site 1241 for the time interval from 3.5 to 4.5 Ma with power spectra, coherency spectrum, and phase relationships. Both records were interpolated at 2-k.y. steps. The number of lags was set to 50% of the time series (bandwidth = 0.003). All relationships are coherent above the 80% confidence level (nonzero coherency level = 0.52). Positive phases (in k.y.) indicate that percent sand lags insolation forcing.


![]()