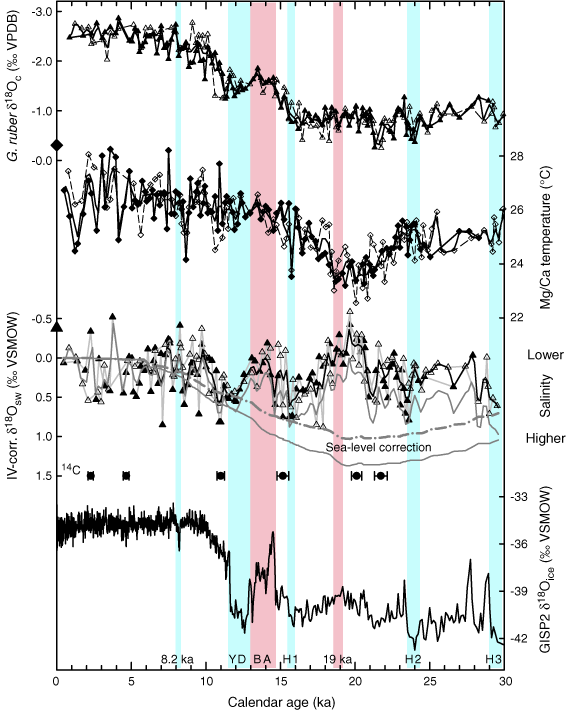
Figure F13. Stable isotope and Mg/Ca data from Site 1242 (open symbols), and site survey Core ME0005A-43JC (solid symbols, data from Benway et al., 2006).  18OC of planktonic foraminifer G. ruber. Mg/Ca-based temperature estimates for G. ruber: Mg/Ca was analyzed using the method of Benway et al. (2003) and converted to temperature using Mg/Ca = 0.38Exp(0.090T) (Anand et al., 2003).
  18Osw estimates calculated from G. ruber Mg/Ca and
  18OC (Bemis et al., 1998; Thunell et al., 1999) and corrected for ice volume (IV) changes (Clark and Mix, 2002; Waelbroeck et al., 2002): solid line = scaling of 0.01
 /m, dashed line = scaling of 0.0075
 /m decrease in relative sea level. For the combined records of the two sites a Gaussian smoothing function (time step = 0.2 k.y.; filter width = 0.8 k.y.) was applied. Calendar-corrected radiocarbon dates are shown with ±1
 error bars. GISP2
  18Oice (Grootes and Stuiver, 1997), indicating high-latitude air temperatures: cold (blue bars) and warm (or sea level rise) events (red bars) of the last 30 k.y. are indicated. 8.2 ka cold event; YD = Younger Dryas cold event; BA = Bølling-Allerød cold event, H1, H2, H3 = Heinrich events; 19 ka = earliest postglacial sea level rise. VSMOW = Vienna Standard Mean Ocean Water, VPDB = Vienna Peedee belemnite.


 18OC of planktonic foraminifer G. ruber. Mg/Ca-based temperature estimates for G. ruber: Mg/Ca was analyzed using the method of Benway et al. (2003) and converted to temperature using Mg/Ca = 0.38Exp(0.090T) (Anand et al., 2003).
  18Osw estimates calculated from G. ruber Mg/Ca and
  18OC (Bemis et al., 1998; Thunell et al., 1999) and corrected for ice volume (IV) changes (Clark and Mix, 2002; Waelbroeck et al., 2002): solid line = scaling of 0.01
 /m, dashed line = scaling of 0.0075
 /m decrease in relative sea level. For the combined records of the two sites a Gaussian smoothing function (time step = 0.2 k.y.; filter width = 0.8 k.y.) was applied. Calendar-corrected radiocarbon dates are shown with ±1
 error bars. GISP2
  18Oice (Grootes and Stuiver, 1997), indicating high-latitude air temperatures: cold (blue bars) and warm (or sea level rise) events (red bars) of the last 30 k.y. are indicated. 8.2 ka cold event; YD = Younger Dryas cold event; BA = Bølling-Allerød cold event, H1, H2, H3 = Heinrich events; 19 ka = earliest postglacial sea level rise. VSMOW = Vienna Standard Mean Ocean Water, VPDB = Vienna Peedee belemnite.
![]()