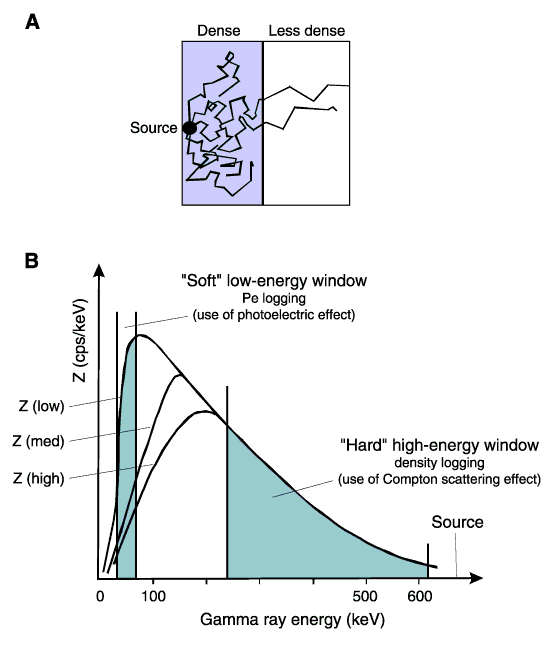
Figure F10. A. Schematic drawing of Compton scattering of gamma rays. The effect is more marked in denser matter (cf. Lavenda, 1985). B. Density and lithodensity (photoelectric) logging in relation gamma ray energy. Density logging uses the high-energy regions where Compton scattering occurs. Photoelectric logging uses the low-energy region where the PEF is dominant. cps = counts per second, Z = atomic number (modified from Ellis, 1987).


![]()