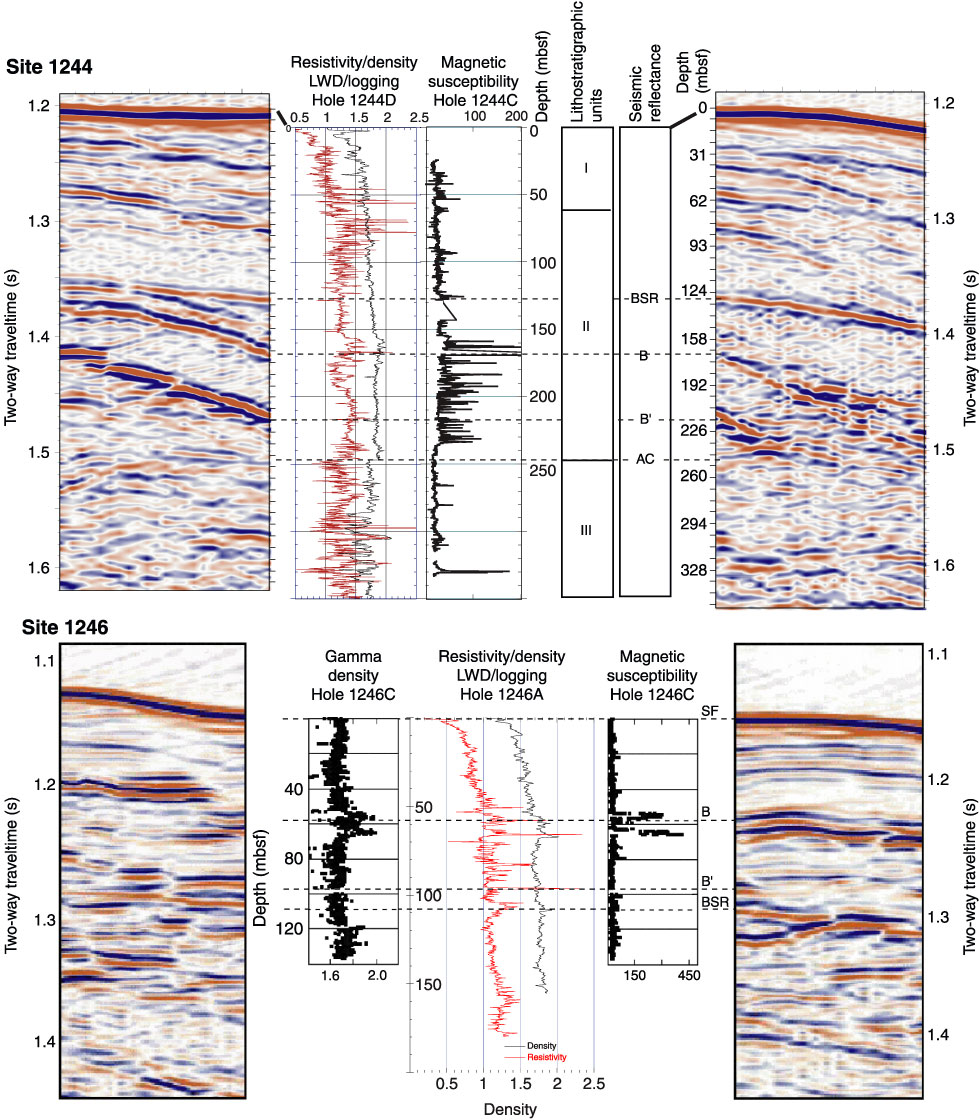
Figure F11. Correlation between 3-D seismic data, density, and resistivity measured downhole by logging while drilling (LWD), gamma density and magnetic susceptibility measured by MST on cores, and lithology at Sites 1244 and 1246. Seismic data were converted to depth assuming a velocity of 1550 m/s above the BSR and 1700 m/s below the BSR, as suggested by 3-D velocity tomography (Arsenault et al., 2001). VSPs confirmed that the velocities from the tomography study are quite close to in situ velocities (Fig. F19). Seismic Horizon B corresponds to a double-peaked, high-density, high-magnetic susceptibility zone and seismic Horizon B´ corresponds to a thick glass-rich turbidite. Lithologic observations indicate that these anomalies result from ash-rich layers that contain a relatively high concentration of gas hydrate.