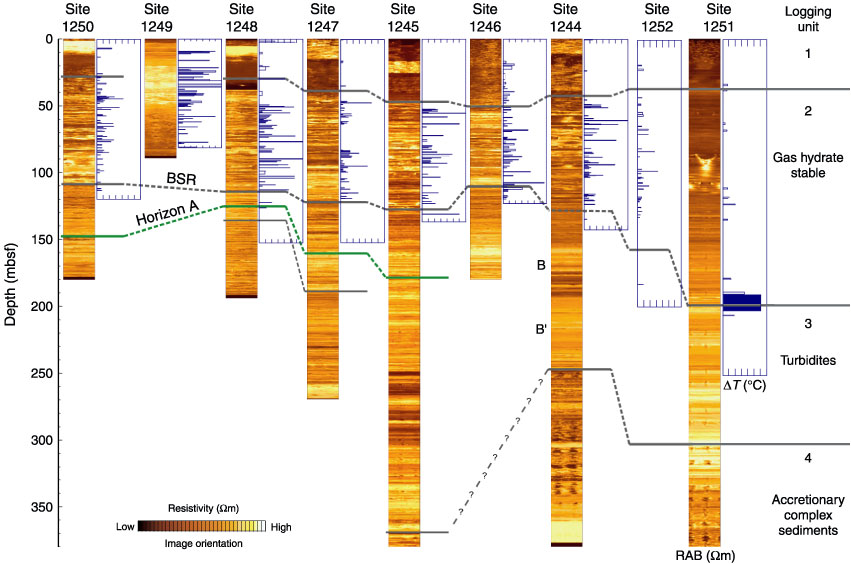
Figure F13. Relative borehole resistivity as imaged by LWD (golden/brown columns) compared to the presence of low-temperature anomalies in recovered cores as imaged by IR camera scans (blue spikes). The resistivity data show a clockwise scan from of the borehole wall north. Light shades represent higher resistivity. Horizontal bands are parallel to the strata, whereas S-shaped bands represent steeply dipping structures. IR anomalies represent the difference between local and background temperature. Background temperature was determined by eye and can be affected by many factors, including air temperature on the catwalk and coring method. Horizon A and the top of accretionary complex as defined by increased fracturing and variable density in the LWD data are shown. BSR = bottom-simulating reflector, RAB = resistivity at the bit.