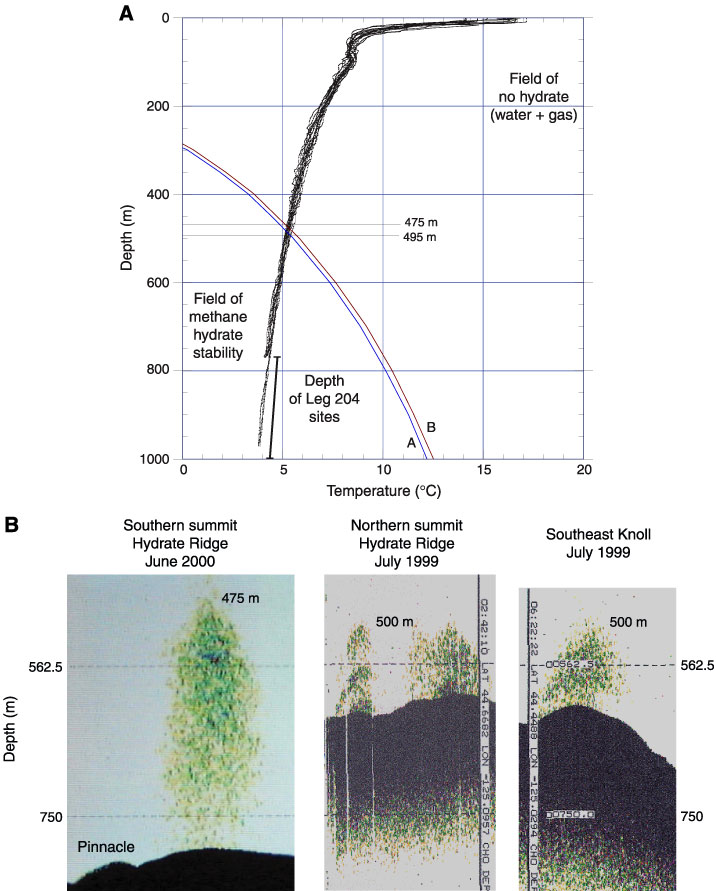
Figure F3. A. Water temperature profiles from conductivity/temperature/depth recorder profiles of the water column over southern Hydrate Ridge. The stability boundaries for (A) pure methane hydrate and (B) a mixture of 97.5% methane and 2.5% hydrogen sulfide are shown, as are the water depths of Leg 204 sites. B. Echo sounder records (12 kHz) from the Hydrate Ridge region showing bubbles in the water column (Torres et al., 1999; Tréhu and Bangs, 2001).