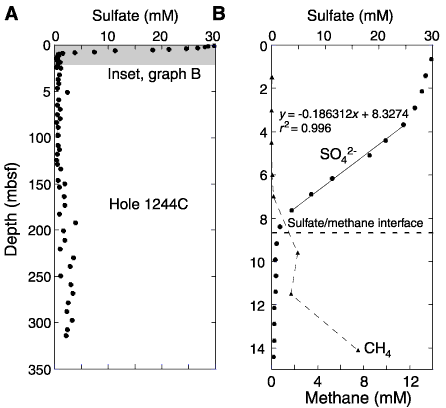
Figure F19. Sulfate (SO42-) concentration profile at Hole 1244C including (A) the entire penetrated sedimentary section and (B) a detailed profile from the seafloor to 15 mbsf that also shows interstitial methane concentration from headspace data (see "Organic Geochemistry"). In A, note that the sulfate concentration decreases rapidly from 29.7 mM (Sample 204-1244C-1H-1, 65-75 cm [0.65 mbsf]) to levels <1 mM (Sample 2H-3, 65-75 cm [9.15 mbsf]). Samples below ~9 mbsf contain residual amounts of sulfate <1 mM, and this amount increases below ~135 mbsf coincident with the onset of XCB drilling. The shaded portion of the profile appears in B, where the curvature of the sulfate profile at both the top and bottom of the sulfate reduction zone can be clearly observed. A linear portion of the curve is present between ~4 and 8 mbsf, and this portion was used to calculate upward methane flux at Site 1244 based on the shown linear regression. The SMI is also shown at a depth of ~8.5 mbsf, where sulfate concentration falls below 1 mM with a concomitant increase in interstitial methane concentration.


![]()