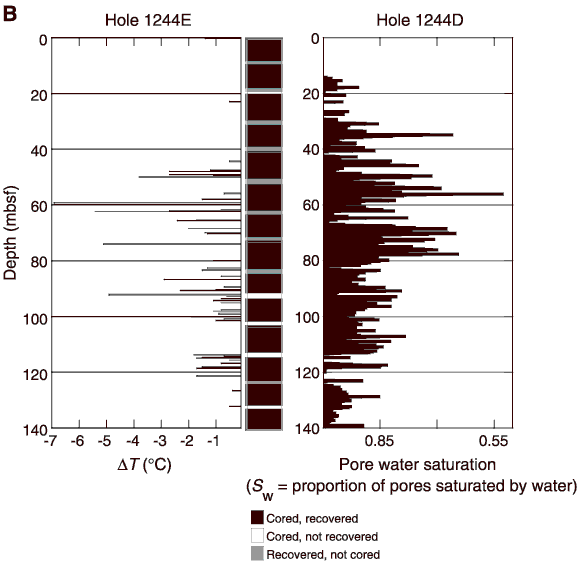
 T) from IR imaging of Holes 1244C and 1244E. B. Downcore temperature anomalies (T) from IR imaging for Hole 1244E compared with estimated hydrate concentrations from LWD resistivity in Hole 1244D. Resisitivity data are plotted in terms of apparent pore water saturation using Archie's Relation; the estimated hydrate concentration is 1.0 Sw (see "Downhole Logging").

![]()