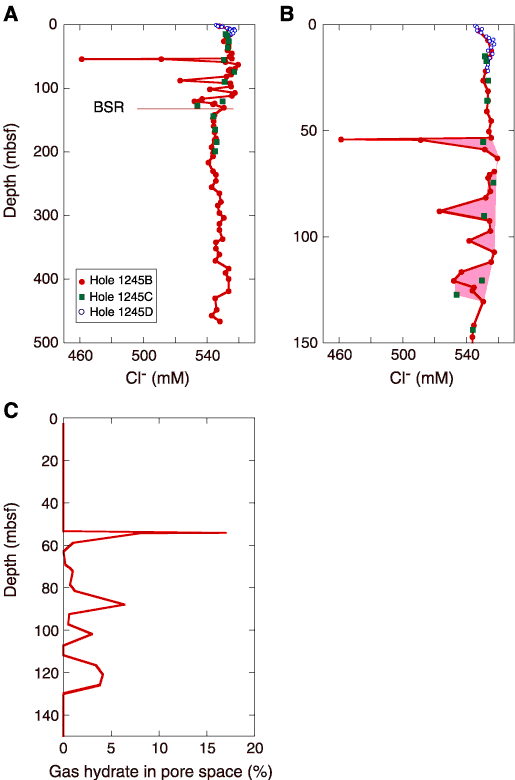
Figure F24. Chloride (Cl-) concentration profile and estimates of gas hydrate amounts using these chloride data. A. Chloride concentration profiles from Holes 1245B, 1245C, and 1245D with the precruise estimate of the depth of the bottom-simulating reflector (BSR). B. Interpretation of the location of gas hydrates (red shading) within the GHSZ. Note that the baseline used for this interpretation is established by connecting the highest chloride concentration values within the GHSZ, which presumably represent in situ Cl- concentration. C. Interpretation of the amount of gas hydrate as a percentage of pore space. Note that the sample with the freshest chloride concentration predicts 18% gas hydrate, whereas other occurrences of gas hydrate occupy from 0% to 6% of the pore space.