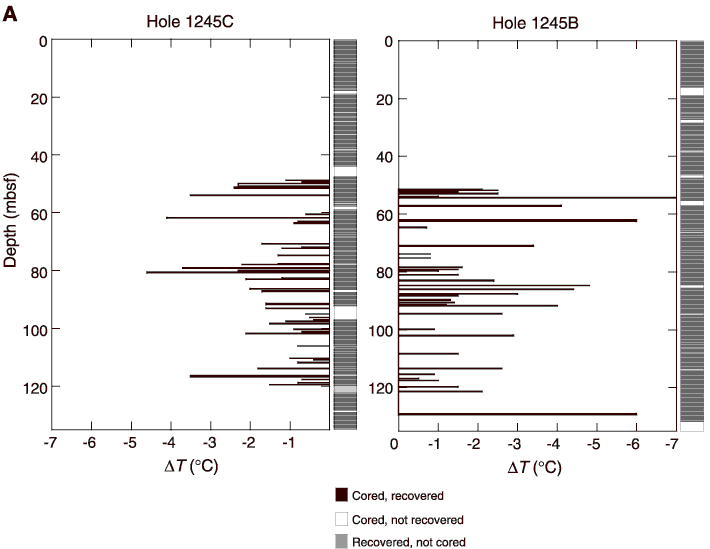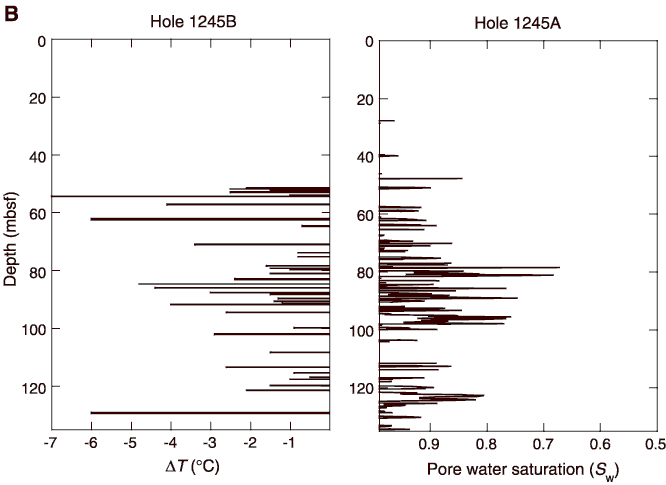
Figure F36. A. Comparison of temperature anomalies from IR imaging between Holes 1245B and 1245C. B. Comparison of IR temperature anomalies in Hole 1245B and pore water saturation as determined from LWD resistivity in Hole 1245A (see "Downhole Logging").


![]()