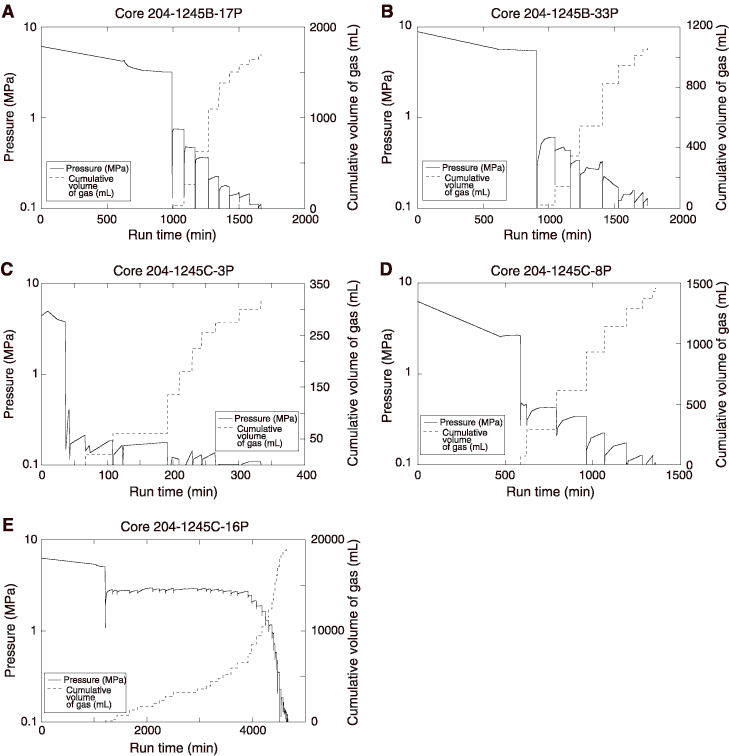
Figure F44. A-E. Volume-pressure-time plots for PCS deployments at Site 1245. Note that in Core 204-1245C-16P, pressure kept increasing to values equal to or above the pressure measured in the previous gas release, until ~4000 min of the run, suggesting the decomposition of gas hydrate.


![]()