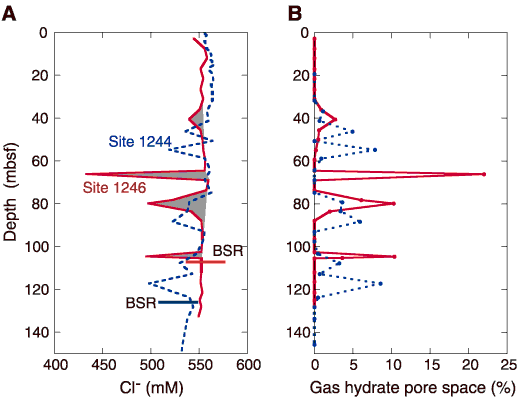
Figure F9. A. Cl- concentration data from Site 1246, showing excursions to fresher values superimposed on a near-vertical baseline and the position of the bottom-simulating reflector (BSR). Interstitial Cl- data from Site 1244 (dotted blue lines) are shown for comparison. B. Estimates of the fraction of pore space occupied by gas hydrate at Sites 1246 (red circles) and 1244 (blue circles) from the available IW data.


![]()