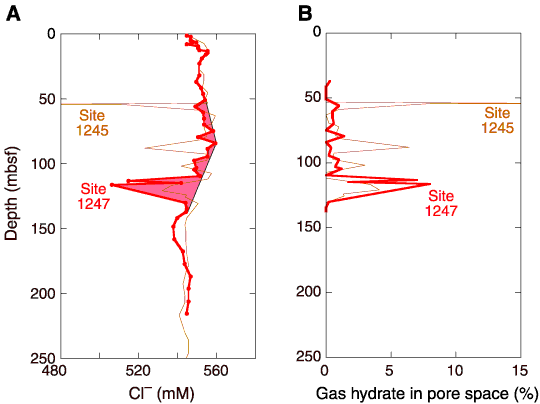
Figure F13. Chloride (Cl-) concentration profile for Site 1247 and calculation of gas hydrate amounts as a percentage of pore space. Chloride data from Site 1245 (thin line) are shown for comparison. A. Chloride concentration data show anomalies toward freshening between ~56 and 116 mbsf, indicating the presence of gas hydrate between these depths. The data form gently sloping baselines with an inflection point at ~85 mbsf. These data are similar to those documented at Site 1245. B. Using the baselines established from the chloride data in A, the largest chloride anomaly predicts that about 10% of pore space is filled by gas hydrate at 116 mbsf. Above this depth, 0%-2% of the pore space is occupied by gas hydrate.


![]()