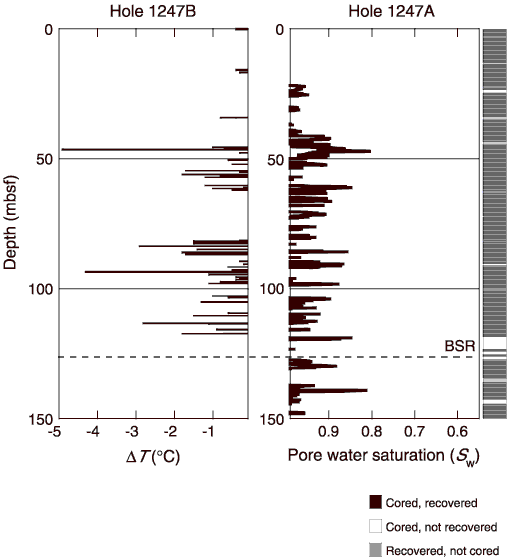
 T) and Sw as calculated from LWD resistivity data at Site 1247. Resistivity data are plotted in terms of apparent Sw using Archie's Relation; the estimated hydrate concentration is 1.0 - Sw (see "Downhole Logging"). BSR = bottom-simulating reflector.

![]()