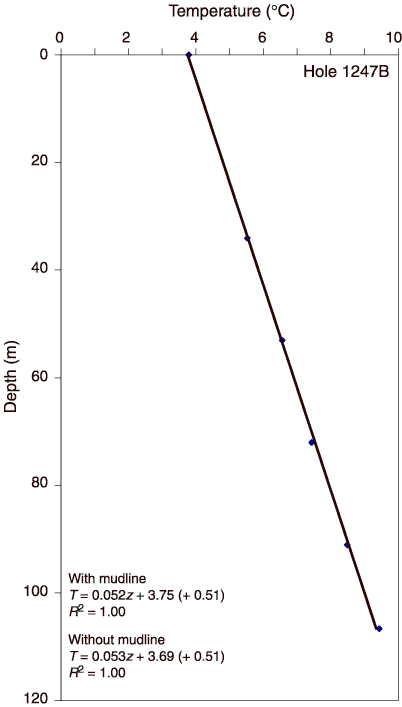
Figure F29. Subsurface temperatures plotted vs. depth beneath the seafloor at Site 1244. The equation for the best fitting linear thermal gradient for all the data, as well as best-fit gradients for several subsets of the data (see explanation in text) are also shown. A calibration correction of 0.51% is indicated, where all measurements were made using APCT 11 (see "Downhole Tools and Pressure
Coring").


![]()