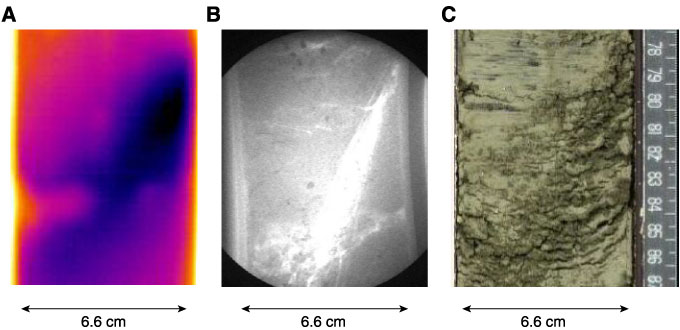
Figure F26. Close-up images of a vein or layer of hydrate in Section 204-1249F-9H-3. A. Thermal IR image before start of experiment. The hydrate is associated with -6°C temperature decrease relative to the gas hydrate-free interval. B. X-ray image before start of experiment showing fracture dipping at ~45°. C. Digital photograph of the split-core archive half at the end of the experiment, showing mousselike texture of the sediments.