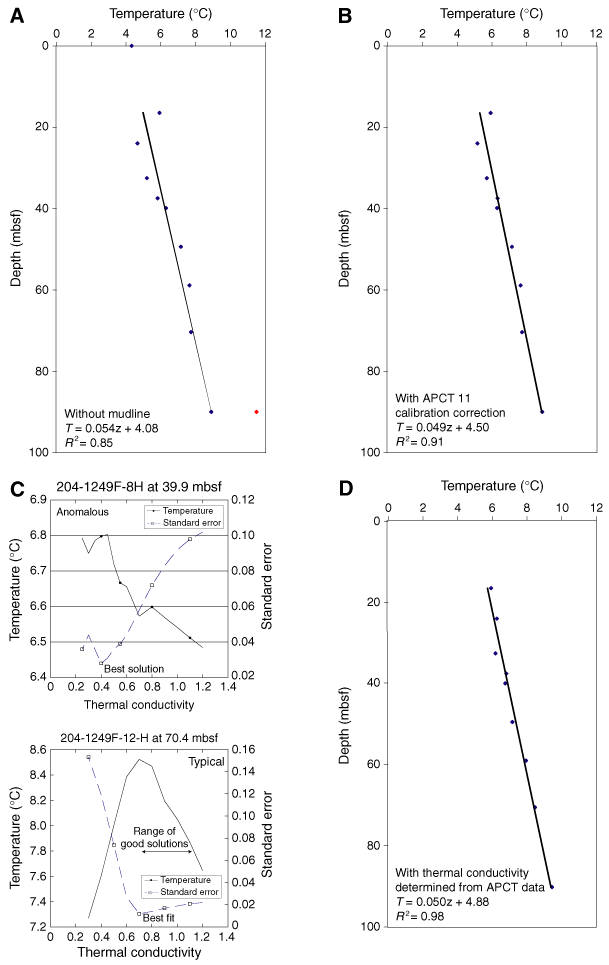
Figure F28. A. Subsurface temperatures plotted vs. depth beneath the seafloor at Site 1249. The equation for the best fitting linear thermal gradient for all the data is also shown. B. Effect of adding 0.051°C to all temperatures derived from APC temperature (APCT) tool 11. C. Best fitting temperature and the misfit of the data for that temperature as a function of the assumed thermal conductivity assumed. See "Downhole Tools and Pressure Coring" in the "Explanatory Notes" chapter for further explanation. D. Effect on the apparent thermal gradient of simultaneously determining in situ temperature and thermal conductivity.


![]()