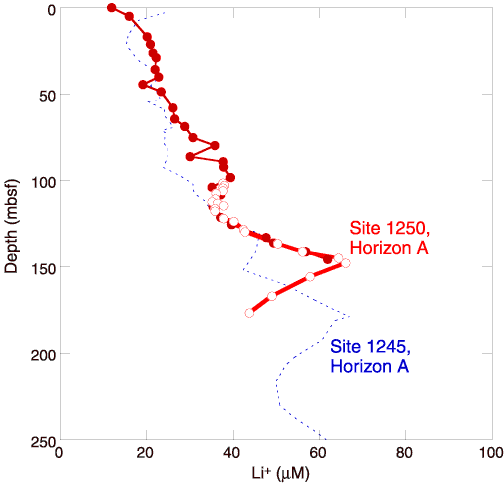
Figure F18. Dissolved lithium data from Site 1250 (red circles) shown with lithium concentration data from Site 1245 (dotted line) and their relationship to Horizon A at each site. Note that each site exhibits a sloping baseline showing increasing lithium concentration with depth. Both sites also show locally higher concentrations of dissolved lithium at Horizon A, with a similar magnitude of lithium enrichment.


![]()