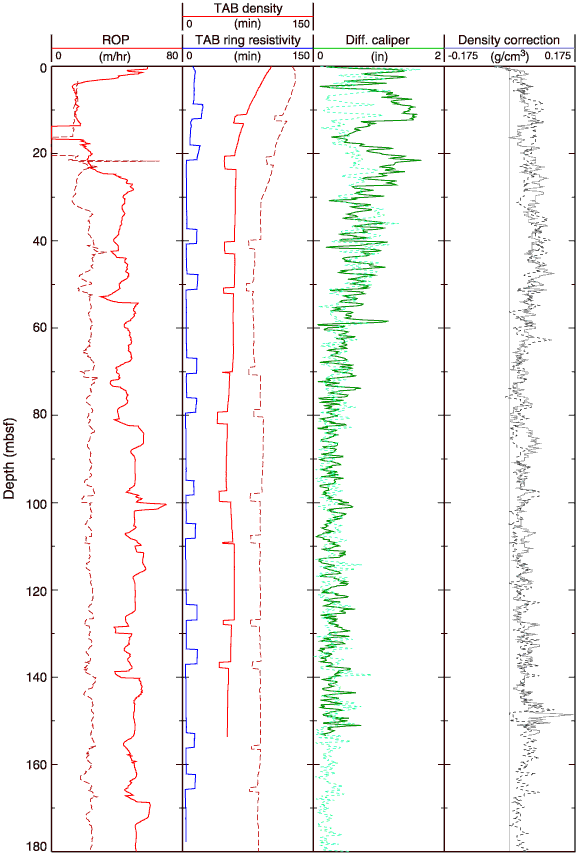
Figure F34. Quality control LWD logs from Holes 1250A and 1250B. The solid line curves represent the logging data from Hole 1250B, whereas the dashed lines represent the logging data from Hole 1250A. ROP = rate of penetration, TAB = time after bit, Diff. = differential.