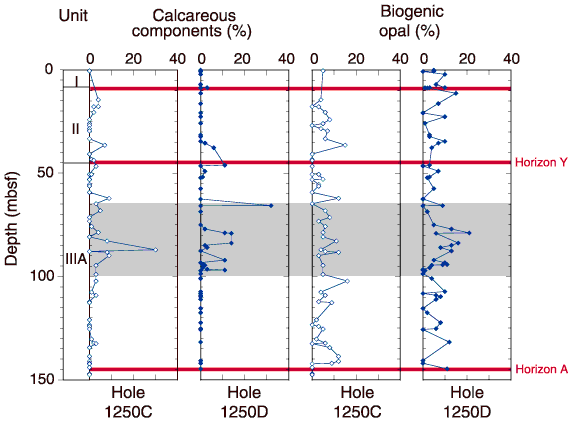
Figure F8. Distribution of biogenic components (calcareous and siliceous) vs. depth in Holes 1250C and 1250D based on smear slide descriptions. Main lithostratigraphic units and seismic horizons are depicted. A gray-colored interval corresponds to the debris flow deposit located between 75 and 100
mbsf.


![]()