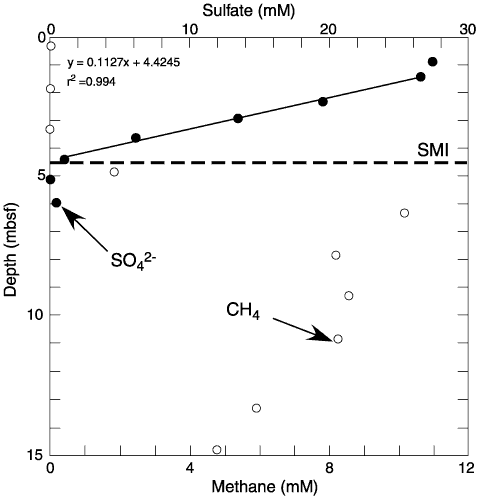
Figure F15. Sulfate (SO42-) and methane (CH4) concentration profile at in the upper 15 mbsf at Site 1251. Sulfate data are from Hole 1251E, where high-resolution sampling occurred in conjunction with microbiological studies. Interstitial methane concentrations are from headspace data from Hole 1251C (see "Organic Geochemistry"). The sulfate profile is linear through the majority of the sulfate reduction zone, with curvature at both the top and bottom of the sulfate reduction zone. This linear portion of the curve was used to calculate upward methane flux at Site 1251, based on the shown linear regression. The sulfate/methane interface (SMI) is also shown at a depth of ~4.5 mbsf, where sulfate concentration falls below 1 mM; interstitial methane concentrations were depth shifted ~30 cm to correspond to the sulfate data.