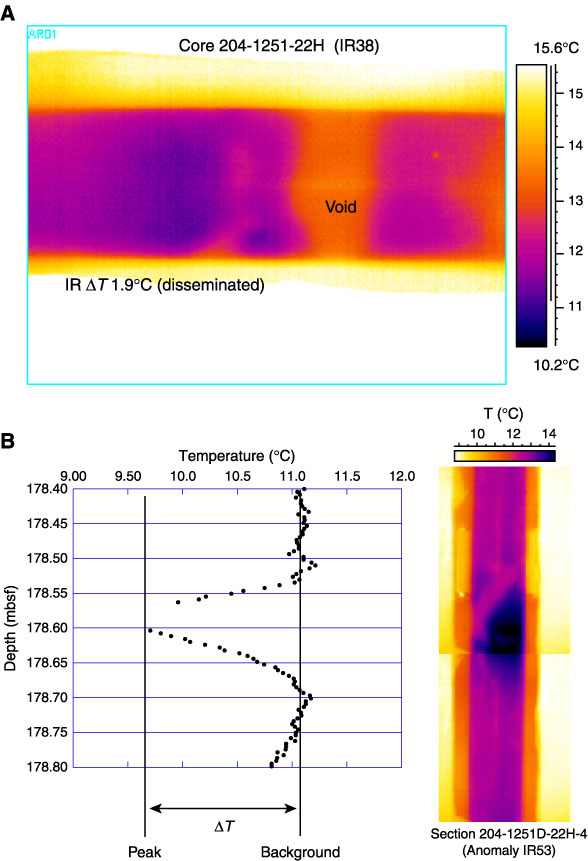
Figure F24.A. Example of a cold anomaly in an IR image associated with disseminated hydrate. B. Close-up example of IR images and an associated cold-spot anomaly of T = -1.5°C. The images were taken from Section 204-1251B-22H-4 at 178.4-178.9 mbsf. The T is the difference between an average background temperature and the minimum temperature in the cold-spot anomaly (see Table T12).
 T = -1.5°C. The images were taken from Section 204-1251B-22H-4 at 178.4-178.9 mbsf. The