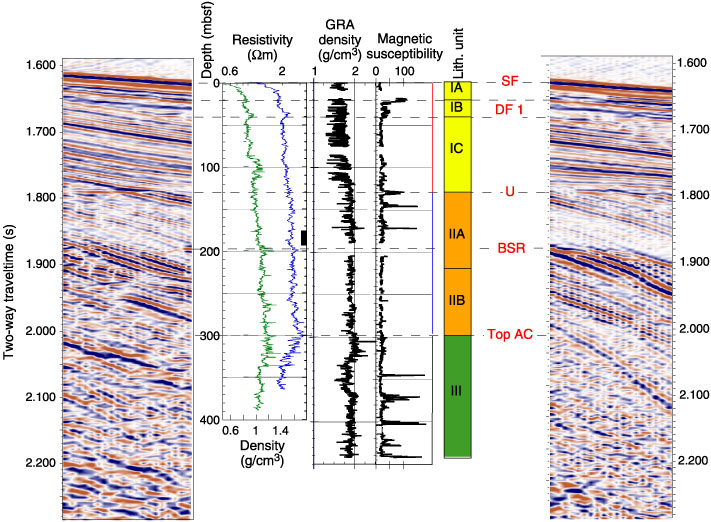
Figure F4. Seismic reflection profile from west (left) to east (right) across Site 1251. Correlation of lithostratigraphic units and subunits and seismic reflection, downhole gamma ray attenuation (GRA) density, MS, and CWL electrical resistivity (left curve) and CWD density (right curve) are shown. BSR = bottom simulating reflector, AC = accretionary complex, DFl = debris flow 1 (see Fig. F5). U = unconformity. Note the location of the only gas hydrate sample recovered at this site from Hole 1251D (see Fig. F20 in the "Leg 204 Summary" chapter). SF = seafloor, DF = debris flow, BSR = bottom-simulating reflector.