![]() Figures F1-F20
Figures F1-F20
![]() Figures
F21-F30
Figures
F21-F30
![]() Tables
T1-T10
Tables
T1-T10
F1. Bathymetric map.
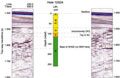
F2. Lithostratigraphic summary.
F3. Seismic reflection profile.
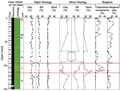
F4. Clay, silt, sand, and calcareous and biogenic components.
F5. Holocene/Pleistocene boundary.
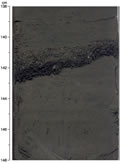
F6. Debris flow deposit.
F7. Sulfide precipitates and graded turbidite.
F8. Glauconite distribution.
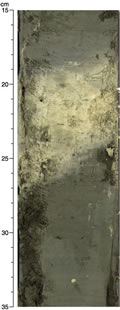
F9. Glauconite sand layer.
F10. Authigenic carbonate precipitates.
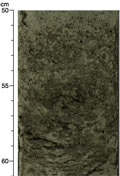
F11. Mousselike texture.
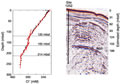
F12. Age-depth plot.
F13. Various dissolved species.
F14. Chloride concentrations.
F15. Sulfate and methane concentrations.
F16. Headspace C1, C2, C2=, C3=, and C3.
F17. Dissolved methane and sulfate.
F18. C1, C2, and C3 in core void gas.
F19. C1/C2 ratio.
F20. Downcore temperature profiles.
![]() Figures F1-F20
Figures F1-F20
![]() Figures
F21-F30
Figures
F21-F30
![]() Tables
T1-T10
Tables
T1-T10