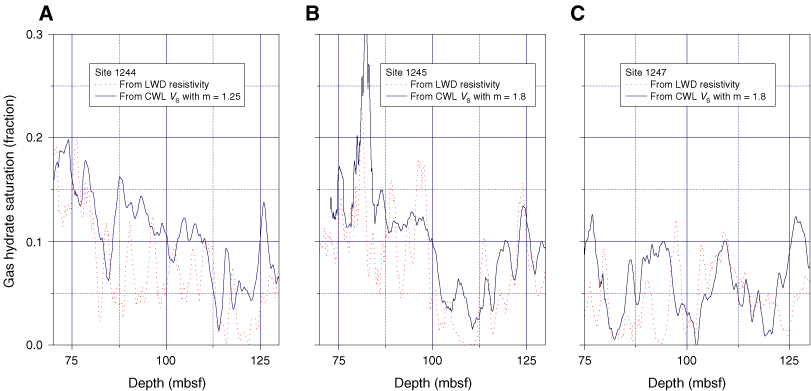
Figure F6. Gas hydrate saturations estimated from the S-wave velocity using the BGTL and parameters shown in Table T1
are denoted as heavy solid lines. Dotted lines represent saturations estimated from electrical resistivity logs. All estimates are smoothed using 11 points (average sampling = 0.15 m). A. Site 1244. B. Site 1245. C. Site 1247. LWD = logging while drilling, CWL = conventional wireline logging.


![]()