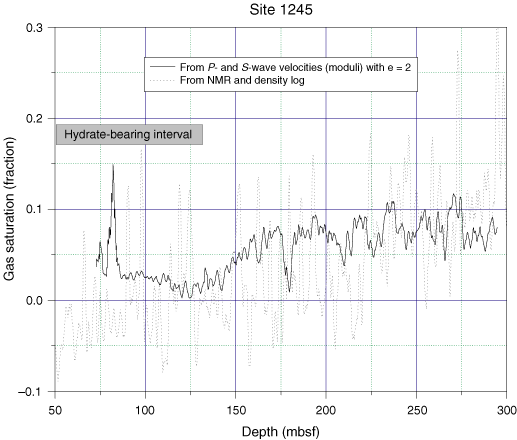
Figure F8. Estimated saturations of free gas at Site 1245. The dotted line represents the estimated free gas from the nuclear magnetic resonance (NMR) and density-derived porosity logs, and the solid line represents the estimated free gas using the moduli method with e = 2. All estimates are smoothed using 11 points (average sampling interval = 0.15 m).


![]()