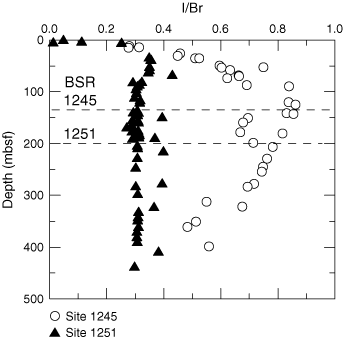
Figure F4. Depth distribution of I/Br (mM/mM) ratios in Sites 1245 and 1251. Whereas the profile for the slope basin Site 1251 reaches constant values with depth, a pronounced maximum in I/Br ratios is visible at flank Site 1245 just above the bottom simulating reflector (BSR).


![]()